
Tamara Vukovic is an Account Specialist at Bobsled.
At Bobsled, we are seeing an increasing number of reporting needs across multiple client accounts. From general analytics to specific inventory data, Vendor Central can generate many different types of reports based on your brand’s needs. Understanding how Vendor Central functions - and how to monitor your brand’s performance through it - is an opportunity to build a stronger relationship with Amazon. Knowing which reports focusing on can also increase the integrity of your catalog in the marketplace, the profitability of your channel, and your overall sales revenue.
Since we last reviewed Amazon Vendor Central reports in 2020 with our Amazon Vendor Central Tutorial Series, there have been a few new additions and features. Most of the information from the tutorial is still relevant but I still want to update you with some of the more noteworthy reports that are now available on Vendor Central. With so many different types of reports available, it’s a good idea to know which ones you should be tracking regularly.
Today, I’m going to share the three best Vendor Central reports that will help you gain a deeper understanding of your brand’s limits on Amazon. I’ll offer two more in the next blog to provide even further insight into which key data points you should consider on the platform. For now, take a look at three essential reports features that can help make a huge difference in the way you track your company’s continued health in the eCommerce space.
Why Vendor Central Reports are Imperative to Your Brand’s Success
Vendor Central reports offer insight that you may not be able to track anywhere else. This insight is invaluable for finding out details about what’s working on Amazon (and what isn’t). You can manage and track all of your business reports and metrics with the help of the Vendor Central portal to provide customers with accurate and timely information upon request.
For some brands, failing to understand the ins and outs of Vendor Central’s report system have have a negative impact on their performance and health as time goes on. Vendor Central reports contain key data that can prove invaluable to any company’s marketing strategy.
The bottom line is this: if you aren’t tracking issues and account performance concerns through Vendor Central reports, you are putting your brand at risk for decreased profitability, dwindling market shares, and an increasingly negative relationship with Amazon.
How Bobsled Helps Clients Find the Right Reports
The majority of our clients ask the same series of questions regarding reports on Vendor Central. Some brands may not know if they are even reading their reports correctly, let alone how to best use the information listed in the report to make a real change in brand strategy moving forward.
When a brand consults with our Bobsled team, they learn how to properly find, generate, and read reports on Vendor Central. It’s important to understand not only how to track certain metrics, but whether or not they are important enough for your marketing plans. I personally like to enrich Vendor Central reports with pivots, charts, and graphs to help clients gain an even clearer understanding of what they’re looking at. Over time, sellers on Amazon become more educated on how Vendor Central works and how to keep up to speed with important metrics on the platform.
Here are three of the most impactful reports that you should be using on Vendor Central right now:
1. Analytics Report - Sales Diagnostics
Analytics Reports are part of the Sales and Traffic dashboard on Vendor Central. This report will help you identify the different sales opportunities for your products, offering a summarized or detailed view of your metrics within a given time frame. You can filter through many search parameters, including an individual ASIN.
The table in your Analytics Report shows the major contributing KPIs such as your overall revenue, the number of units sold, customer views of a product detail page, and conversion rate on each of your products. You can click through any of the headers on the table to sort by specific metrics.
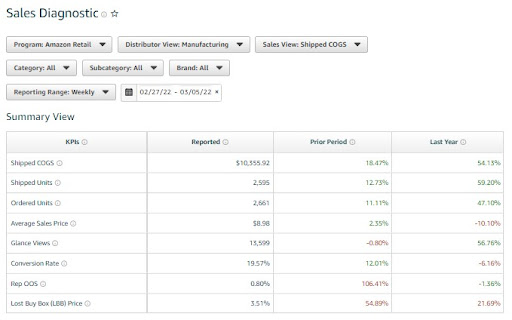
The time period of the report can be adjusted to any custom period that Amazon has data for by clicking the date range window in the upper part of the page.
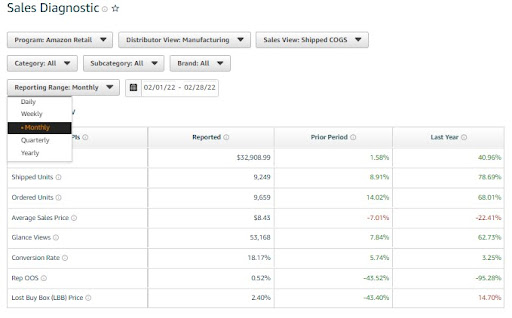
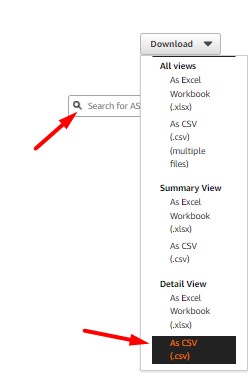
You can also use the ASIN filter in the upper-right hand corner of the page to view COGS information on an ASIN level. You can also export your data to see a more detailed snapshot of your metrics.
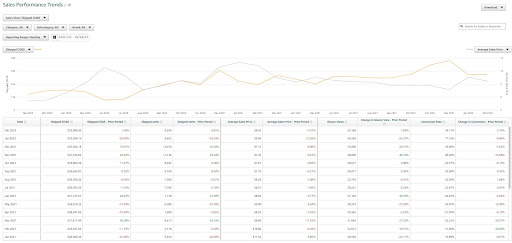
As an additional feature to this report, you can also add the Sales Performance Trends Report to help further identify trends influencing your sales performance. The graph on top gives you an overview of the metric, and you can sort by a given date frame once again.
An Important Note About Sales Reports
Any brand that uses Amazon Vendor Central has instant access to Amazon Retail Analytics, also known as ARA. ARA is available as a free Basic version or a Premium version which requires over $30,000 per year. Both versions of ARA offer reports on returns units, gross sales, prices, COGS, on-hand inventory units, cost, and unsellable units. There are three major areas where ARA Basic and ARA Premium differ:
- Geographic location reporting. ARA Basic offers data gathered by country; with ARA Premium, you can search all the way down to the postal code.
- Time reporting. You can get weekly data delivered to you each week through ARA Basic. If you want daily data, you need ARA Premium.
- Historical data. There are no free backup options offered through the ARA Basic plan, but at the Premium price, you can get historical data backed up for up to a year at a time.
You can explore more of the benefits and drawbacks of the different ARA versions to make more informed decisions about your marketing needs. Find additional information about brand analytics tracking on Amazon Seller Central.
2. Operational Performance Report
Operational Performance Reports will allow your brand to track specific operational issues that could have occurred during inventory transit to one of Amazon’s fulfillment centers. While every business must account for some loss, a struggle in performance could indicate that something needs to be fixed at the operational level.
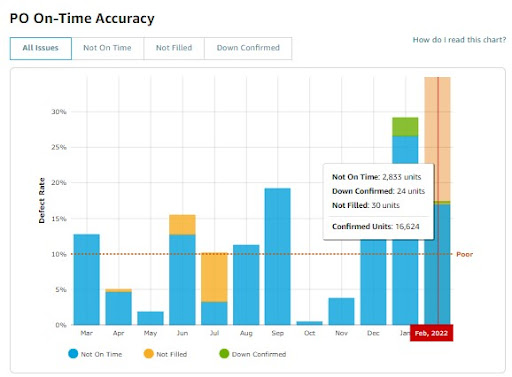
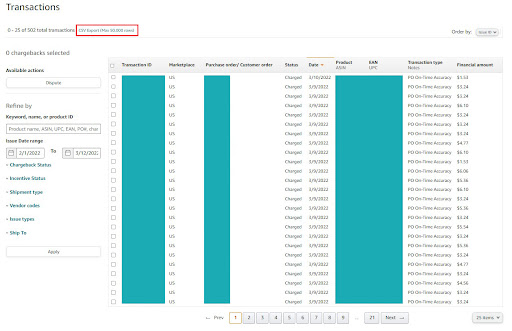
This is a critically useful report for tracking all types of performance, reviewing infractions, and discovering chargebacks. All of these available actions can be taken in the Operational Performance Dashboard.
Taking a Closer Look at Supply Chain Data
Some brands are not aware that when Amazon signs on a new vendor as an ordering source, the vendor is expected to comply with all supply chain requirements that are set out in the Vendor Manual. Brands that fail to comply with the requirements will generate an infraction.

You can go on an easy deep dive into your data by using the different tabs available at the top of the screen. You can search by the transaction’s financial amount or by chargeback subtype.
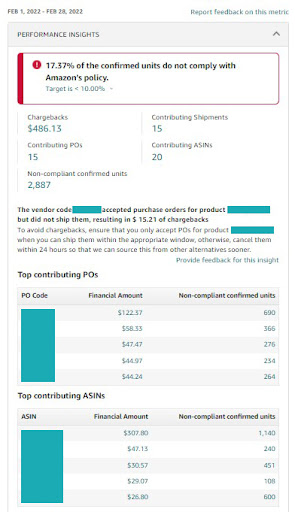
To the right of the chart is your performance summary. It will show you key performance statistics of the selected metric within the selected time period. You’ll be able to measure KPIs such as total chargebacks, the number of affected ASINs, and the top non-compliants POs and ASINs.
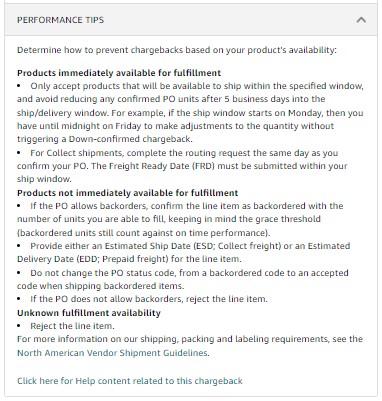
The bottom of the page is where you’ll find performance tips as well as suggestions on how to improve your metrics overall. From time to time, you can also view tips on how to avoid recurring issues.
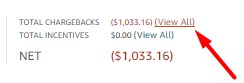
You can track different charges and dispute them with supporting evidence if eligible. On the defect page, you’ll see your list of charges along with associated details for your information. Feel free to export this info as an Excel file for a more in-depth view.
I’ll be providing more information about chargebacks in Part 2 of this blog. If you want to get a head start and research chargebacks now, you can read more about vendor chargebacks and their effect on profit margins to stay ahead of the game.
3. Inventory Report
Inventory reports are long and often multi-faceted, making them all the more crucial to understand. There are two main types of Inventory Reports with subsequent subtypes and metrics underneath them:
Forecasting
The Forecasting report makes an assessment of inventory levels for an upcoming sales period. This is key in preventing overstock or understock, as well as general OOS issues as the season goes on. Forecasting reports will help you avoid a negative impact on sales due to an inventory issue.
There are four main types of Forecasting reports:
- Mean Forecast: Shows the best average estimate based on customer demand.
- P90 Forecast: This shows up when there is a 90% chance of Amazon buying the indicated demand level and 10% that they will buy more than the indicated demand level.
- P80 Forecast: This shows up when there is an 80% chance of Amazon buying the indicated demand level and 20% that they will buy more than the indicated demand level.
- P79 Forecast: This shows up when there is a 70% chance of Amazon buying the indicated demand level and 30% that they will buy more than the indicated demand level.
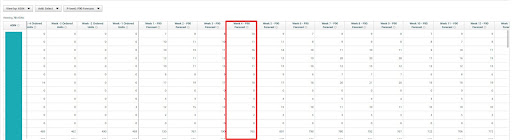
At Bobsled, we typically use a Week 4 P90 Forecast report and filter it on an individual ASIN level. With this type of report, Amazon estimates a 90% probability that your weekly customer demand will be at or below a certain value in the next 4 weeks. Inventory lead times and individual client needs can alter the length or type of Forecast report.
Inventory Health
An Inventory Health report tracks the health of all of your brand’s products. You should be set up to receive weekly updates from this report that will help you quickly track down and implement any critical inventory trends. For this to really work, it’s imperative to monitor the right KPIs. The number of open purchase orders and the amount of on-hand inventory available to sell are two good indicators to start with, for example. Find more info about these and other important metrics below!
Other Useful Metrics
One of the most important metrics that brands of all sizes should be tracking in an Inventory Report is Sellable On-Hand Units. This will tell you how many units of a specific ASIN are currently in the Amazon Fulfillment Center. The report is not in real-time, so it doesn’t always match what customers might see on the product details page.
When used in conjunction with another metric called Open Purchase Order Quantity, vendors often discover issues that may make it more difficult to get your goods shipped out of the Fulfillment Centers. This causes a delay in the receiving process, sending a virtual traffic jam throughout the entire supply chain.
On occasion, it may also be useful to track the number of Unsellable On-Hand Units that are currently being stored in Amazon’s Fulfillment Center. Items that are damaged are often marked as unsellable. A large number of unsellable items could mean that the vendor should start optimizing the preparation and packaging process to avoid further quality issues.
An Inventory Report can also track helpful indicators such as Unhealthy Units that sit in excess on the last day of a forecasted demand time frame, and Aged 90+ Days Sellable Units that barely make the cut and can be sold on the last day of a forecasted demand time frame.
Bobsled Clients Often Track Inventory Health
One Bobsled client recently requested that their inventory health be tracked on a daily basis. They particularly wanted to measure the number of sellable on-hand units. The vendor would leverage this data to figure out why the process of receiving units through Amazon was taking longer than usual. The brand found itself to be out of stock more than it should be.
The report showed how many units from any given ASIN are physically sitting in the Fulfillment Center at any given time. Reviewing the report revealed that there were issues in receiving the goods from these Fulfillment Centers. This delayed process could be due to a clog up the supply chain on Amazon’s side, or it could be because of a busy holiday season. Either way, the client worked internally by reaching out to their own carriers. By tracking inventory levels regularly and teaming up with Bobsled to keep up on their PDP status, the number of ASINs with in-stock units increased over time.
Keep Your Eyes on More Vendor Central Reports
There are even more Vendor Central reports that you and your marketing team should stay apprised of on a regular basis. I’ll be publishing a follow-up post with additional reports and tips in the coming weeks. Subscribe to our newsletter to stay up-to-date on the latest information for brands pursuing an omnichannel marketing approach to boost eCommerce success.